You are here: Reports and Graphs > Six Sigma Analysis with Minitab > Viewing Results in Minitab
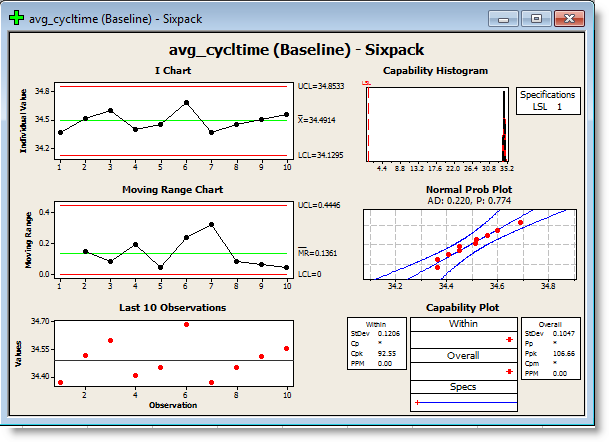
Two charts are generated in Minitab per scenario for each Six Sigma analysis item defined in the Six Sigma Configuration dialog, the Capability Analysis Chart and the Capability Sixpack Chart.
Please Note
ProModel assumes that the data generated is normalized and creates the charts in Minitab accordingly. It is up to the person validating the results to determine the normality of the data.
Toggle between the Minitab charts by double-clicking on them in the Project Manager panel, located by default on the left in Minitab.